What is OLAP?
Databases store information about business transactions, plus other data such as employee records. Those types of systems are called online transaction processing (OLTP) databases. OLTP data contains a wealth of information that can help you make informed decisions about your business. The process of analyzing your data for that type of information, and the data that results, are collectively called business intelligence.
You can spend a lot of time and money trying to extract business intelligence information from your database. The time and expense involved in retrieving answers (queried information) from databases means that a lot of business intelligence information often goes unused. The reason: most operational databases are designed to store your data, not to help you analyze it. The solution: an online analytical processing (OLAP) database, a specialized database designed to help you extract business intelligence information from your data in a structured manner.
Microsoft� SQL Server� 2000 Analysis Services is a high-performance online analytical processing (OLAP) tool for performing data analysis and data mining.
Introduction to OLAP Architecture
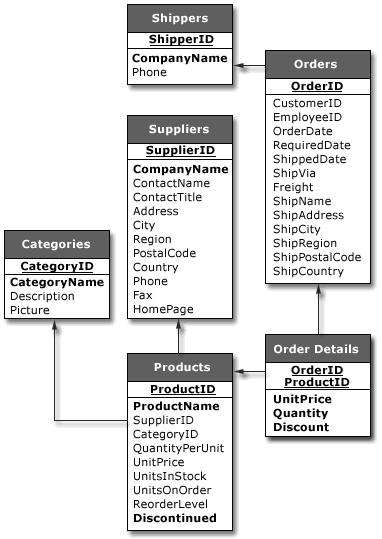
The following figure depicts some of the tables and relations that exist in the Northwind sample database provided by Microsoft� SQL Server� 2000:
The following figure depicts how part of the Northwind database could look when converted to OLAP (Start Schema):
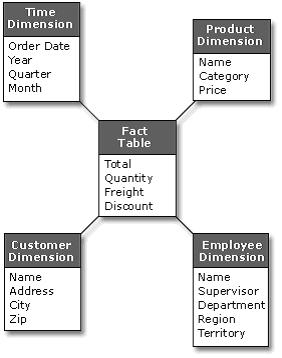
The central table in the schema is the fact table. Fact tables contain numeric data, such as zip codes, and additive data such as the total costs of freight for all beverages.
By themselves, numeric facts do not have much meaning. For instance, the number 206 by itself does not mean much. However, it takes on more meaning if you know that it represents an area code or the number of dishwashers sold yesterday. In a star schema, dimension tables contain the descriptive text that gives meaning to the numbers. Keep in mind that most analyses involve time, which makes time itself a key dimension.
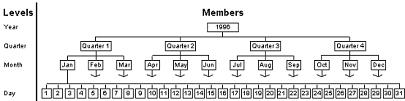
The facts in a dimension are called members. By design, OLAP databases group the related facts in a member into hierarchies whenever the underlying data supports that type of structure. For example, the Time dimension in the preceding figure contains the following hierarchy:
Hierarchies use traditional parent/child relationships. For instance, Quarter is a child of Year, Month is a child of Quarter, and so on. If a child contains data that your OLAP system can aggregate, its parent level contains those aggregated sums. Some systems call those aggregated sums rollups. Whenever you drill up or down through your data, you navigate through those hierarchies as shown in the following figure:
The following figure gives an overview on cube (the main multidimensional structure in OLAP).
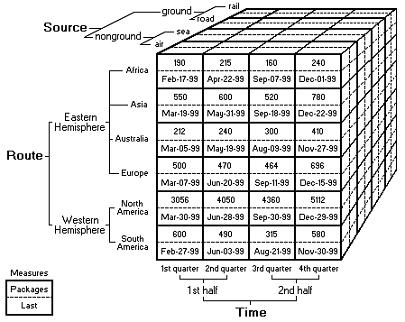
The above cube shows that it has 3 dimensions (excluding measures) namely, Source, Route and Time. All the 3 dimensions have several members (underneath them) grouped into 2 or more levels together linked in the form of a hierarchy. The measure is nothing but an aggregation of a particular column from the perspective view of dimension(s). According to the above figure, it has two measures i.e., Number of packages and Last transaction.
Note: The above explanation is just a brief introduction to the overall architecture on OLAP. For further information, refer to SQL Server 2000 online documentation or MSDN.
Accessing OLAP using ASP.NET - Technical Terms in OLAPTo make this document simple, I provide only the definitions for the commonly used technical terms in OLAP. For more information, refer to SQL Server 2000 Online documentation.
Data warehouse
A database specifically structured for query and analysis. A data warehouse typically contains data representing the business history of an organization.
Data mart
A subset of the contents of a data warehouse. A data mart tends to contain data focused at the department level, or on a specific business area.
fact table
A central table in a data warehouse schema that contains numerical measures and keys relating facts to dimension tables. Fact tables contain data that describes specific events within a business, such as bank transactions or product sales.
dimension
A structural attribute of a cube, which is an organized hierarchy of categories (levels) that describe data in the fact table. These categories typically describe a similar set of members upon which the user wants to base an analysis. For example, a geography dimension might include levels for Country, Region, State or Province, and City.
level
The name of a set of members in a dimension hierarchy such that all members of the set are at the same distance from the root of the hierarchy. For example, a time hierarchy may contain the levels Year, Month, and Day.
hierarchy
A logical tree structure that organizes the members of a dimension such that each member has one parent member and zero or more child members.
multidimensional structure
A database paradigm that treats data not as relational tables and columns, but as information cubes that contain dimension and summary data in cells. Each cell is addressed by a set of coordinates that specify a position in the structure's dimensions. For example, the cell at coordinates {SALES, 1997, WASHINGTON, SOFTWARE} would contain the summary of software sales in Washington in 1997.
cube
A set of data that is organized and summarized into a multidimensional structure defined by a set of dimensions and measures.
member
An item in a dimension representing one or more occurrences of data. A member can be either unique or nonunique. For example, 1997 and 1998 represent unique members in the year level of a time dimension, whereas January represents nonunique members in the month level because there can be more than one January in the time dimension if it contains data for more than one year.
measure
In a cube, a set of values that are based on a column in the cube's fact table and are usually numeric. Measures are the central values that are aggregated and analyzed.
Accessing OLAP using ASP.NET - How to install Analysis ServicesHow to install Analysis Services
Open and View OLAP Information/Data
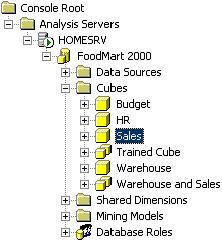
�Foodmart 2000� is a sample OLAP database created by SQL Server 2000 Analysis Services during installation. The following are the steps to view that OLAP (database) information:
� Open Start -> Programs -> Microsoft SQL Server ->
Analysis Services -> Analysis Manager.
� Open Analysis Servers -> <Server Name> -> Foodmart
2000 -> Cubes ->and select Sales (as shown in the following)
� On the right hand side pane, click on Data tab and you should be able to see something like the following:
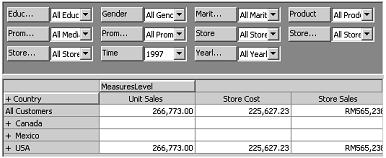
� You play by dragging and dropping the combo boxes (dimensions) either on
to columns or rows on the grid and observe the measures.
This sample web application uses the existing demonstration database named �Foodmart 2000�, which gets automatically installed by SQL Server 2000 Analysis Services (please refer to the previous topic).
This sample application was tested using the following software setup:
The .NET Framework doesn't natively support data access for multidimensional (i.e., OLAP) data sources. So, OLAP developers have to use existing COM-based ADO MD (Multi Dimensional) for application development. Programming with ADO MD is much like programming with ADO. Like ADO, ADO MD has two primary ways of retrieving information: You can retrieve metadata from the schema rowsets, or you can execute queries.
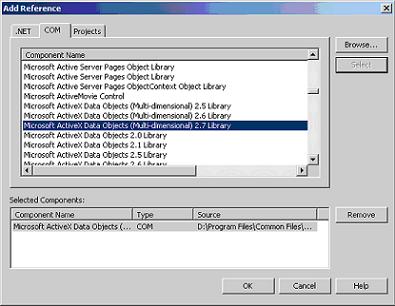
To start programming with ADO MD from Visual Studio .NET, import the ADO MD type library into your .NET project. Do this the same way as adding a reference in Visual Basic (VB) 6.0. In Visual Studio .NET, open the Project menu and select Add Reference. In the resulting dialog box, click the COM tab and scroll down to select Microsoft ActiveX Data Objects (Multi-dimensional) 2.x Library (as shown in the following figure). After selecting the type library, click Select, and then click OK. You've added the type definitions from the library to your project.
The entire source code is as follows:
Imports ADODB
Imports ADOMD
Imports System.Data.OleDb
Public Class DispInfo
Inherits System.Web.UI.Page
.
.
.
Private Sub Page_Load(ByVal sender As System.Object, ByVal e As System.EventArgs) Handles MyBase.Load' Build the MDX statement(Query)
Dim szMDX As String
szMDX = szMDX & "SELECT "
szMDX = szMDX & "{[Measures].members} ON COLUMNS,"
szMDX = szMDX & _
"NON EMPTY [Store].[Store City].members ON ROWS"
szMDX = szMDX & " FROM Sales"' Connect to the OLAP server
Dim cn As New ADODB.Connection
cn.Open("provider=msolap;data source=localhost")
cn.DefaultDatabase = "Foodmart 2000"' Create a cellset
Dim cs As New ADOMD.Cellset
'cs = Server.CreateObject("ADOMD.Cellset")
cs.ActiveConnection = cn
cs.Open(szMDX)'display the cellset
Me.DataGrid1.DataSource = New DataView(getDataTable(cs))
Me.DataGrid1.DataBind()'clear the resources
cs.Close()
cn.Close()End Sub
Private Function getDataTable(ByRef cs As Cellset) As DataTable
'design the datatable
Dim dt As New DataTable
Dim dc As DataColumn
Dim dr As DataRow'add the columns
dt.Columns.Add(New DataColumn("Description")) 'first column
'get the other columns from axis
Dim p As Position
Dim name As String
Dim m As Member
For Each p In cs.Axes(0).Positions
dc = New DataColumn
name = ""
For Each m In p.Members
name = name + m.Caption + " "
Next
dc.ColumnName = name
dt.Columns.Add(dc)
Next'add each row, row label first, then data cells
Dim y As Integer
Dim py As Position
y = 0
For Each py In cs.Axes(1).Positions
dr = dt.NewRow 'create new row' Do the row label
name = ""
For Each m In py.Members
name = name + m.Caption + "<BR>"
Next
dr(0) = name 'first cell in the row' Data cells
Dim x As Integer
For x = 0 To cs.Axes(0).Positions.Count - 1
dr(x + 1) = cs(x, y).FormattedValue 'other cells in the row
Nextdt.Rows.Add(dr) 'add the row
y = y + 1
NextReturn dt
End Function
End Class
The above example is just a sample, demonstrated to access OLAP information through ADOMD and converting it to the .NET, understandable when using the COM interoperability. The same can be further enhanced with all the necessary ingredients to attain much more efficient presentation of information, including charts.